Charts and Visualizations
Risk Distribution
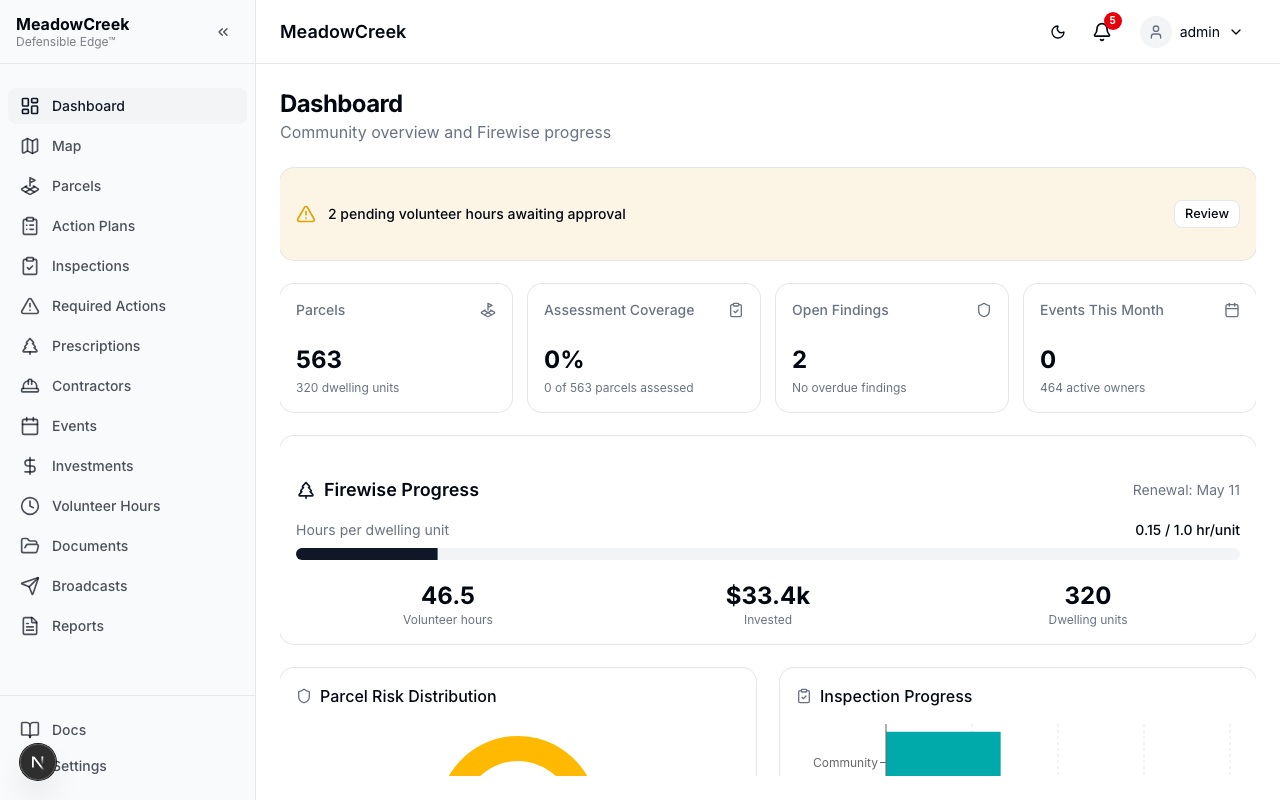
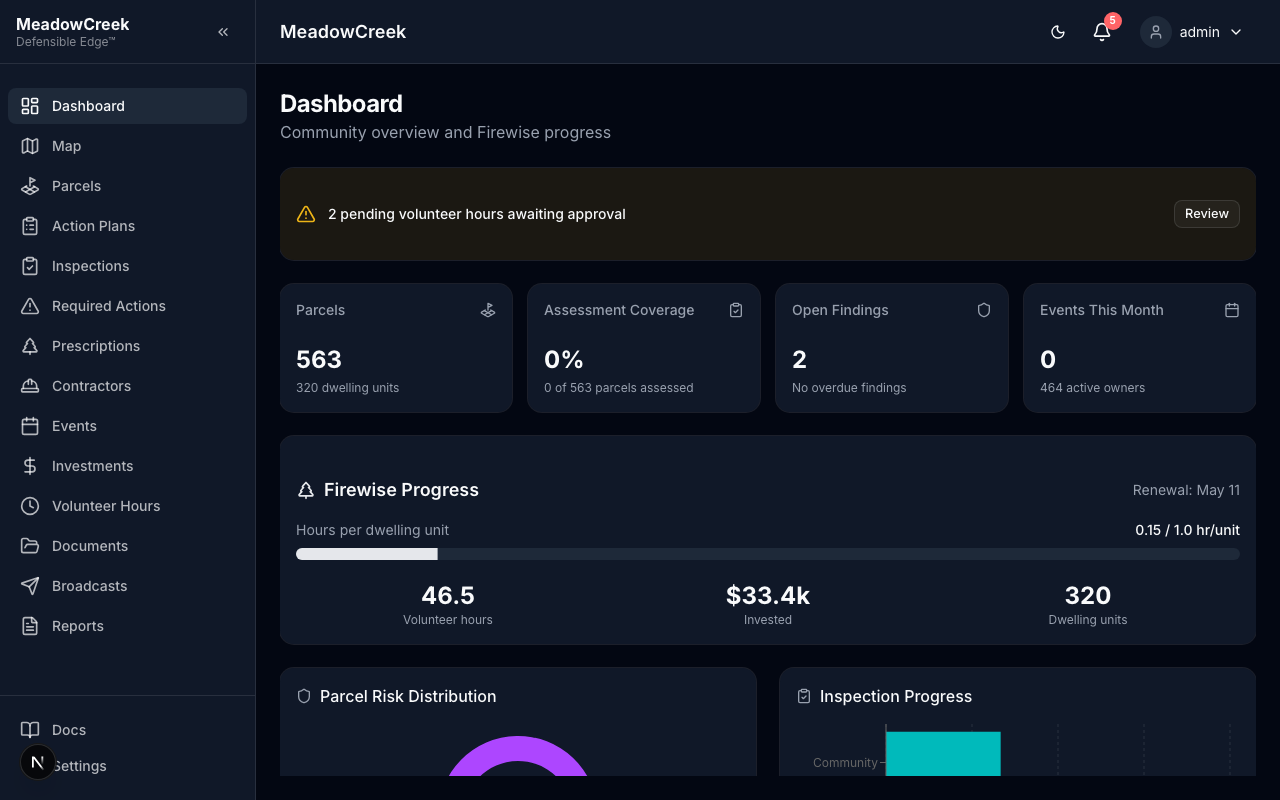
A donut chart showing the breakdown of parcels by risk level: Low, Moderate, High, Extreme, and Unknown. This gives you a quick sense of your community’s overall risk profile.
Inspection Progress
A stacked bar chart displaying inspections by status (Scheduled, In Progress, Completed, Cancelled) grouped by inspection type. Use this to monitor inspection throughput.
Project Completion Tracker
Shows year-over-year project completion rates across your action plans. Each bar represents a year with completed vs. total projects.
Upcoming Events and Inspections
A chronological list of the next 5 upcoming events and inspections, showing the date, title, and type for each item.
Upcoming Deadlines
Displays inspection findings and other items approaching their due dates, with severity indicators and parcel addresses.
Last updated on